The Real Estate Metrics Driving the Housing Environment
Property Management Pulse
A lack of affordability and housing supply has led to a shocking increase in the number of adults aged 35 and under still living with their parents. Nearly 25.2 million (1 in 3) young adults haven’t moved out despite the majority of them being employed.
This isn’t surprising, considering that, in 242 cities, new starter homes now cost upwards of a million dollars. Renters aren’t any better off, either, as nearly half of them spend more than 30% of their income on rent.
Home prices, however, saw the steepest 9-year decline in May, falling 2.4% year over year. While Memphis saw the steepest price drop, Indiana ranks first in terms of housing affordability and homebuilding to meet future demands.
Is housing affordability improving or declining? The answer is both. Some places are seeing an improvement, while others are not.
Hemlane Brief
- 6.47%: Average 30-Year Fixed-Rate Mortgage
- 2.9%: Inflation Rate
- 0.5%: Change in Rent MoM
1 in 3 Young Adults Are Still Living with Their Parents
A research study conducted by Realtor.com found that, in 2025, nearly 1 in 3 young adults aged under 35 years were still living with their parents. That’s a record 25.2 million adults who haven’t moved out. This number is higher than what we saw during the pandemic.
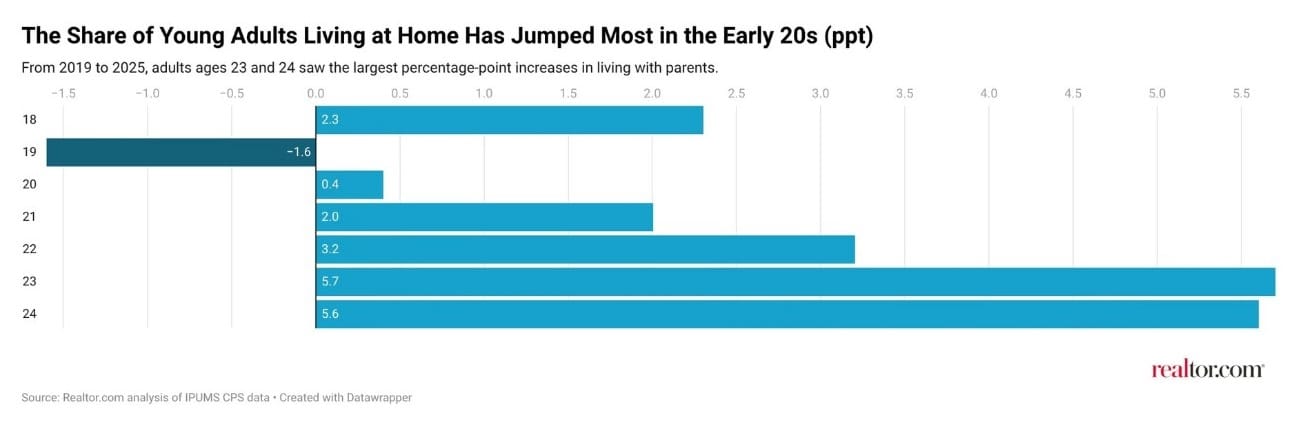
The number of adults aged 25 to 29 living at home has jumped 6 percentage points from 2000, while the percentage of those aged 30 to 34 saw twice the increase. The reason for this isn’t a lack of jobs as one might expect. In fact, 7 in 10 of the adults aged 25 to 34 living at home are employed.
So, what’s the reason for this change where people well into their 20s and 30s are still living at home? A lack of affordability.
Realtor.com highlights that median housing prices have slid up by 34.4% from 2019, while the median asking rent has gone up by 17.9%. This, combined with the 4 million housing unit gap is making it unrealistic for adults to afford independent households.
Debt, including student loans, auto loans, and credit card payments, also add a layer of pressure to young adults today. With nearly 3/4ths of these adults contributing meaningfully to household expenses, they’re left with very little wiggle room when it comes to saving up for deposits or down payments.
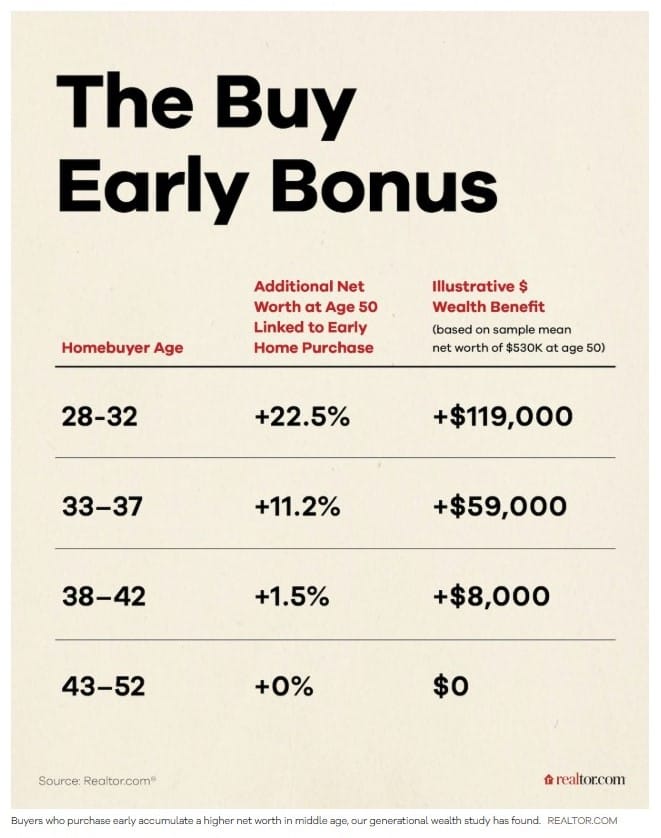
To solve this problem, a lot of older homeowners are holding on to their equity or upsizing with their adult children instead of downsizing. “A retiree brings equity and the adult children bring income, which can be a stronger profile,” says Ashley Harris, the director of homebuyer negotiation at Neighbor Bank.
It also has the added benefit of an early inheritance for the adult children, leading to a boost in their net worth.
Need Collateral for Your Down Payment? Use Crypto
Up until now, if you had to use your cryptocurrency to buy a house, you only had two options: convert it to fiat money (with a high income tax burden), or find a buyer who was willing to accept crypto (very difficult).
However, Fannie Mae recently announced that it will accept crypto assets as mortgage collateral from aspiring homebuyers. This means that anybody who has built their wealth through cryptocurrency can now use it to buy a home. However, it’s important to note that once you pledge your crypto, you can no longer trade it.
Here’s how this will work. Homebuyers seeking to use crypto will have to take out two separate loans. The first will be the traditional 15- or 30-year Fannie-backed mortgage from the mortgage company Better Home & Finance. The second will be a separate loan backed by a type of cryptocurrency (Bitcoin or USDC) to fund the down payment.
The loans will be combined under a single interest rate, term, and monthly payment. These values will be fixed for as long as you continue making payments, even if the cryptocurrency value falls.
Vishal Garg, the CEO of Better, said that this move will remove the down payment bottleneck for those who are “cash-poor but have built their wealth through other assets.”
Housing Report Card Reveals the Status of Homebuilding and Affordability
Realtor.com released its 2026 Housing Report Card that grades all US states on two metrics: how affordable and accessible the homes are for local earners, and how actively each state is building homes to meet future demand.
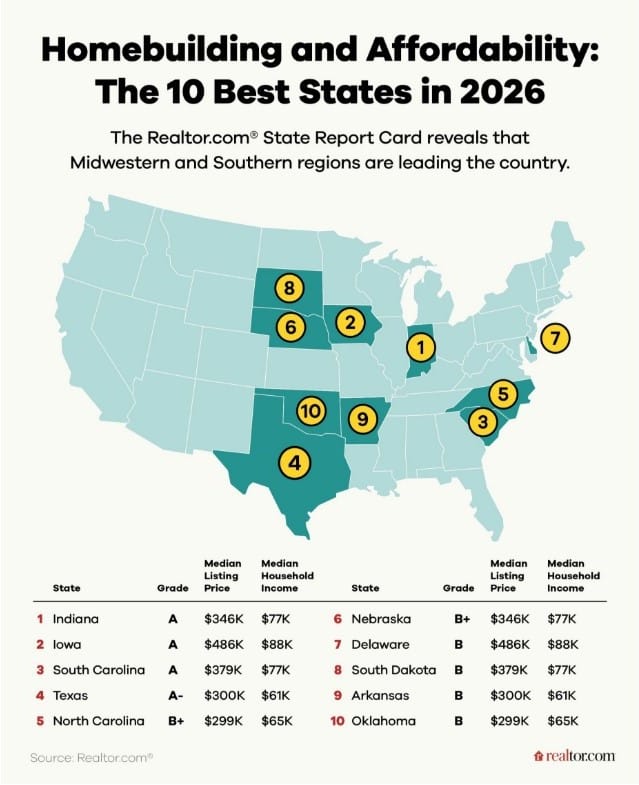


According to the report, Southern and Midwestern states rank at the top in terms of affordability and homebuilding, with Indiana taking the lead overall. This is primarily because Indiana has been performing well in terms of building new houses and is also affordable.
Iowa came in second due to its lukewarm construction permits as well as the fact that a newly constructed home costs 50% more than an existing one. But, the state leads in terms of pure housing affordability, with its median home price of $282,886 costing just 25.4% of its median income (well below the 30% average).
South Carolina, which came in third, requires 36.7% of median income. But, it stands out on the homebuilding front, with newly constructed homes actually costing 5.7% less than existing ones.
On the other end of the scale is New York, which is neither affordable, nor seeing a lot of construction activity. Some of the other states that ranked at the bottom include Massachusetts, Rhode Island, Hawaii, and California.
Where Have Home Prices Dropped the Most?
In May, the housing market saw the steepest decline in median listing prices (2.4% year over year) since 2017. The median price per square footage slid down in 35 out of 50 U.S. metros.
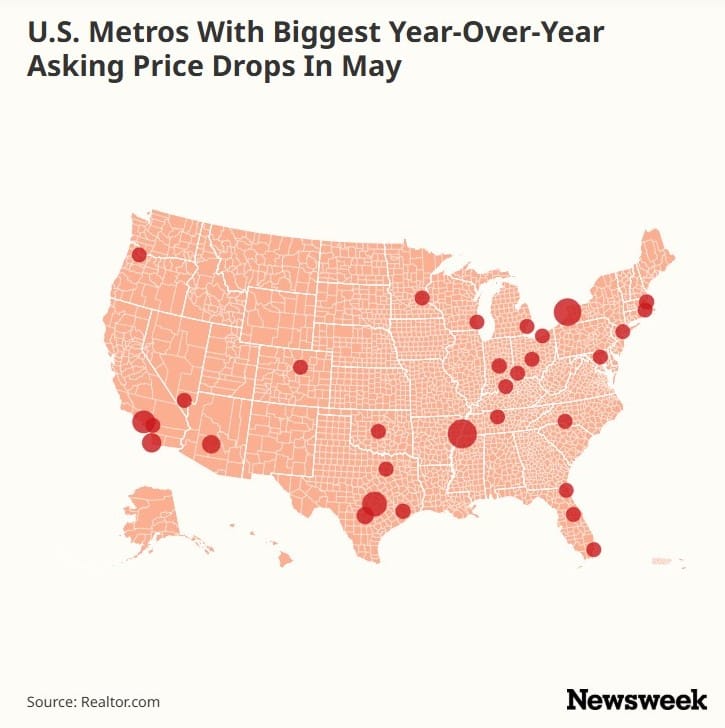
Here are the U.S. metros that saw the sharpest decline:
- Memphis, Tennessee: -13%
- Buffalo, New York: -11.6%
- Austin, Texas: -9.5%
- Los Angeles, California: -7.9%
- San Diego, California: -5.6%
While Memphis is experiencing price drops due to a stagnating market, Austin is undergoing a pandemic boom price correction.
But, there are larger forces at play, such as the U.S.-Iran conflict, inflation, rising home loan rates, and tariff troubles, that are causing buyers to pull back, culminating in sellers dropping their prices.
Despite this, experts believe that there won’t be a housing market crash anytime soon as sellers are pricing more moderately and buyers are still showing up.
Starter Homes Now Cost More Than $1 Million
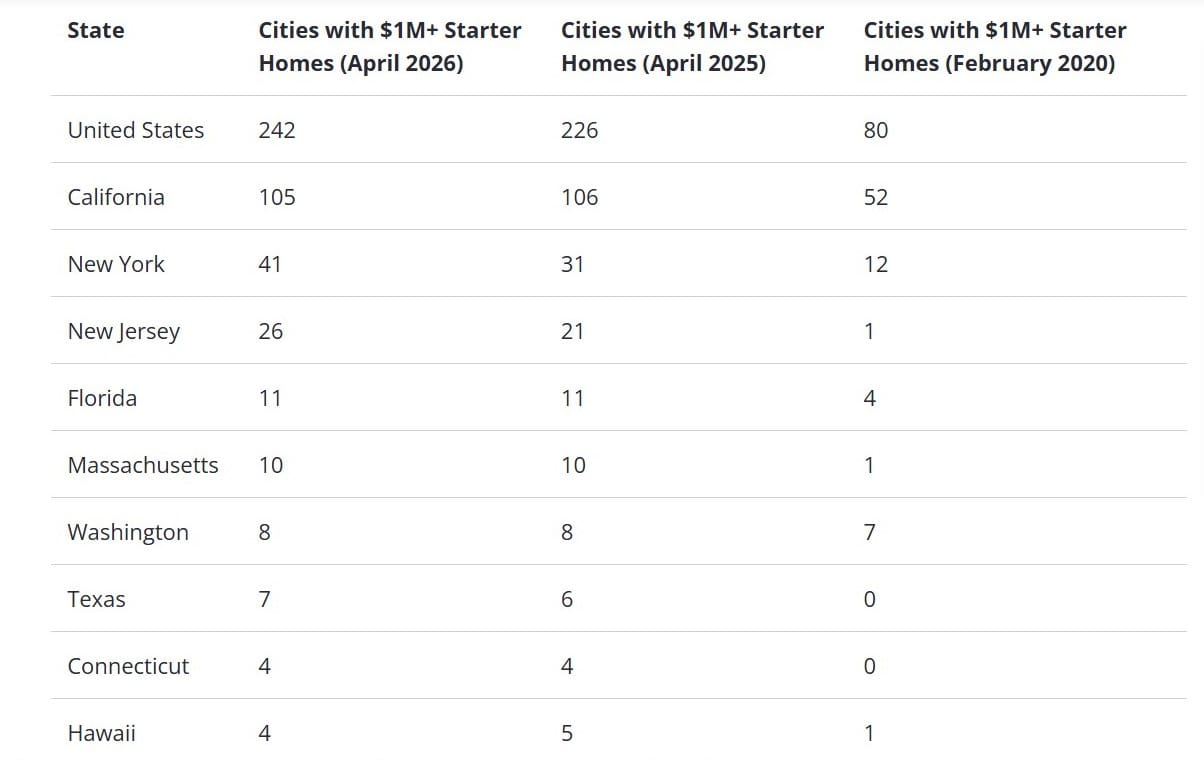
A report by Zillow has revealed that, in more than half of the U.S. states, new starter homes cost more than a million dollars. That’s a total of 242 cities across 26 states where entry-level homes are priced at $1 million or more, eroding affordability.
Just last year, this value was confined to 226 cities. In 2020, starter homes were more affordable, with only 80 cities where they were priced at $1 million or more. Today, the typical starter home is worth $198,649 nationwide, which means million-dollar starter homes still aren’t the norm despite the increase in their numbers.
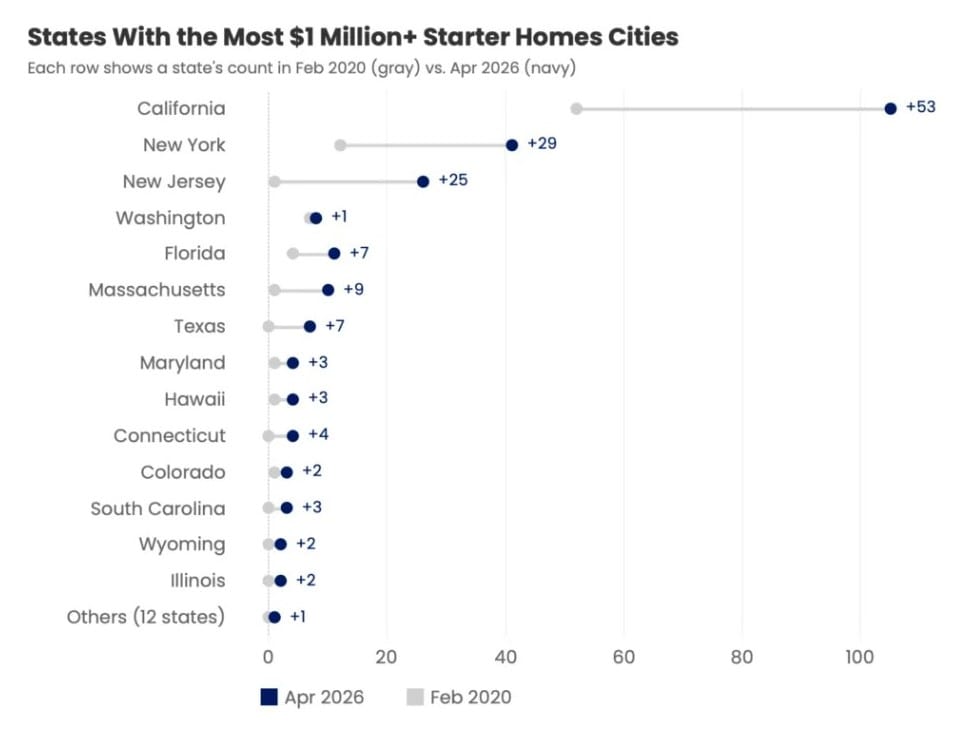
A starter home is typically defined as a home that falls within the bottom 1/3rd of homes by value in a given region. California leads with the most number of cities with million-dollar starter homes, followed by New York and New Jersey.
Here’s a look at how the million-dollar starter home trend has changed among the top cities:
This trend where even the cheapest homes cost 7 figures clearly points at an ever-widening affordability gap. Yet, Zillow notes that things aren’t as bad as they seem as “the typical home buyer now breaks even relative to renting after roughly 6 years, down from more than eight years in late 2023.”
Nearly Half of Americans Are Burdened by Rent
The 30% rule that says that you shouldn’t spend more than 30% of your income on rent is no longer realistic in today’s housing market. Census data analyzed by Newsweek shows that 49.7% of American renters across the country now spend more than 30% on their rent.
Economists widely consider spending anything more than 30% on rent as a cost burden as it can leave precious little for your other essentials. And yet, this is the reality today.
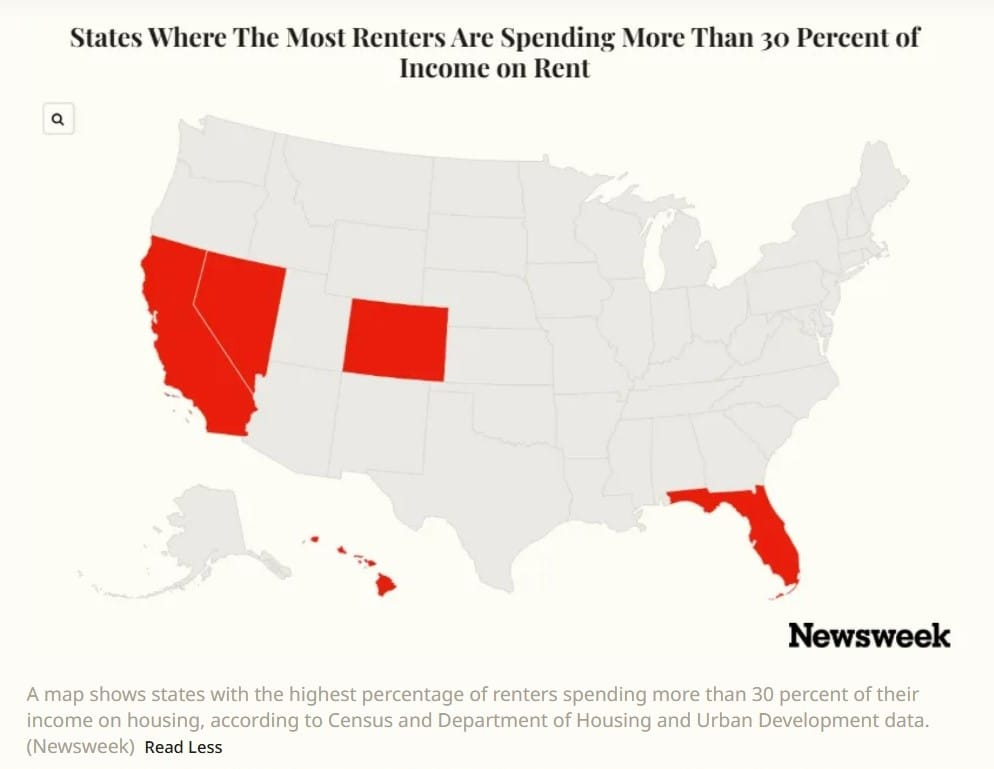
Florida ranks at the top when it comes to states with a high rent burden and a lower average income, followed by Nevada, California, Hawaii, and Colorado. In all 5 places, more than half of all renters spend more than 30% on their rent.
“Higher income areas also typically carry a much higher cost of living overall,” said Kevin Thompson, CEO of 9i Capital Group. “The consequence is many people are being pushed further away from where they work just to find affordable housing, and whatever savings they gain are often eaten up by longer commutes and higher gas prices.”


On the contrary, Midwestern and Southern regions see lower rents and lower costs of living.
Get the Latest in Real Estate & Property Management!
I consent to receiving news, emails, and related marketing communications. I have read and agree with the privacy policy.


